
The Age of the Housing Stock
Mike Kobeissi’s work, with guidance on staging, renovation and design, covers building, remodeling, buying and selling, and the age of a house is one of the plainest guides to how much of that work it will need. The standard measure is the median age of owner occupied homes, counted in years from the year each house was built and drawn from the Census Bureau’s American Community Survey. A median is a midpoint: half of all such homes are older than the figure and half are newer. By that measure, the National Association of Home Builders reports, the typical American owner occupied house was 41 years old in 2023, up from 31 years in 2005.1 The same analysis puts about 48 percent of these homes as built before 1980 and about 35 percent before 1970. It also leaves out 2020, the year the Census Bureau did not release its standard one year survey because of collection problems during the pandemic.1
An aging national stock
- Median age of owner occupied homes in 2023
- 41 years
- The same median in 2005
- 31 years
- Share built before 1980
- 48 percent
- Share added by new construction from 2020 to 2023
- 3 percent
How the stock grew old
A housing stock ages when new building falls behind the houses already standing. The builders’ analysis attributes the rapid aging since the Great Recession to residential construction falling behind, held back more recently by material costs, labor shortages and higher interest rates.1 The arithmetic is stark. From 2020 to 2023, new construction added nearly 2.6 million owner occupied homes, only 3 percent of the total. Homes built from 2010 to 2019 made up about 9 percent, and those from 2000 to 2009 about 15 percent. The share of homes no more than 13 years old fell from 18 percent in 2013 to 12 percent in 2023, while the share at least 44 years old rose from 39 to 48 percent.1 Owners have also stayed put. The same report describes a lock in effect, in which homeowners who borrowed at the very low mortgage rates of the pandemic years chose to renovate rather than move, and it concludes that over the long run remodeling may grow faster than new construction.1 The reasoning is practical: older structures need updates to add amenities their builders never imagined, and repairs or replacements of components that have reached the end of their lives.1
The national median hides wide differences between states. An earlier builders’ analysis of 2021 survey data put the national figure at 40 years and found the oldest owner occupied stock in New York, at a median of 62 years, followed by Rhode Island at 58 and Massachusetts at 57; in the District of Columbia, half of all such homes were more than 80 years old.2 The youngest stock sat in the Sun Belt, where 14 of 15 states fell below the national median. California, at 45 years, was the exception. Nevada’s median was only 23 years, and fast growing Utah and Idaho both stood at 29.2 The pattern follows population: states that grew quickly built recently, and states that lost people kept older houses in service. The same analysis notes that older houses are less energy efficient than new construction and will eventually need remodeling and renovation.2
Median age of owner occupied homes, selected states
What age tends to predict
Age matters because components wear out on schedules, and the year a house was built suggests which ones are due. The National Association of Realtors summarized a 2022 Houzz study of more than 70,000 renovating homeowners that sorted common projects by the decade a home was built, and found that owners of houses built between 1961 and 2000 spent the most, a median of $20,000.3 A Houzz economist quoted there named the limited and aging stock as one of the driving factors of renovation in the United States, with rising interest rates persuading many owners to stay and adapt the houses they had, and others buying older houses that needed work because the cost of entry was lower.3 A seller’s own inspection points the same way. The Wall Street Journal reported a 2022 study that found growing demand for repair work before a house was listed, especially major systems and kitchens more than 15 years old, with heating and cooling, appliances, roofs and electrical repairs the most common nationally. One person quoted in the piece called it a misconception that such an inspection raises a house’s value; its purpose, in that view, is to set accurate expectations on both sides.4
Some old components outlast their replacements. National Park Service guidance on historic buildings notes that windows in many older buildings have worked for more than a century and, with regular maintenance, will usually outlive any replacement, which cannot itself be repaired. It calls the belief that new windows cut energy costs in half a misconception, and cites a 2002 Lawrence Berkeley National Laboratory study in which a storm window over a historic sash performed about as well as a new low emissivity vinyl unit. Its method is a survey taken one window at a time, recording each part and sorting the work into routine maintenance, structural stabilization and parts replacement; when most of the work falls into the first two groups, the window should be repaired. Solid and paneled wooden doors, it adds, insulate well and should be kept.6 The Los Angeles Times profiled repair specialists who rebuild double hung wood windows on their original ropes, pulleys and iron weights, a system that spring balancers began to replace in the late 1920s; one restorer contrasted century old sashes with vinyl replacements expected to last about 15 years, and the paper followed the repair of 17 original windows in a 1907 Craftsman bungalow. The same piece explains that the double hung window was itself a way to cool a house a century ago, with warm air let out through the top sash and cooler air drawn in below.7
What a full home inspection covers
- Grounds and exteriorGrading, drainage, foundation, siding and exterior paint.
- Roof, windows and doorsShingles, gutters, flashing and chimneys; decay, rot and cracks in openings.
- AtticInsulation, ventilation and structural damage.
- Basement or crawl spaceMoisture, pests and foundation issues.
- Interior roomsFloors, walls, ceilings, outlets, switches and fireplaces.
- KitchensAppliances, exhaust fan, drainage and cabinets.
- BathroomsFixtures, tile, caulking, water pressure and leaks.
- Major systemsHeating, cooling, wiring, panels and plumbing, with the age and expected life of each.
The inspection report is where age becomes a list. Bob Vila’s checklist describes a report that should estimate the remaining useful life of the major systems and equipment, the roof, the structure, the paint and the finishes, and then recommend repairs and replacements.5 For the heating and cooling equipment, wiring and plumbing, the inspector should note the age and expected lifespan of each component before turning to specific concerns.5
Walls carry their age as well. Family Handyman’s guide to plaster explains that older walls were built of lime plaster pressed through strips of wood lath, where it hardened into keys that hold it in place, and that cracks usually signal stress or a neglected structural or water problem that must be fixed first.8 Ordinary stud finders cannot read through it, and lime plaster has to be able to release moisture, so sealed insulation and impermeable paint can make it fail. The guide also warns that plaster applied in the middle of the twentieth century may contain unsafe additives and should be tested before demolition, and that walls painted before 1978 should be tested for lead.8 Those materials shape what a remodel involves, a subject that runs through the history of the kitchen and into the way an older house is presented in home staging.
The honest limit of the measure is that a median describes a population, not a house. A figure of 41 years includes houses built last year and houses built a century ago, and it counts only homes occupied by their owners. Year of construction says nothing about how a particular house has been kept: the Park Service’s point about windows is that a well maintained old part can outperform a new one, and the plaster guide treats neglect, not age, as the cause of most failures.68 The statistic says where to look; only an inspection says what is there. What any one house needs, and what to do about it, are questions for its owner’s inspector, contractor and other advisors.
References
- National Association of Home Builders. Almost Half of the Owner Occupied Homes Built Before 1980, 2025 04 08.
- National Association of Home Builders. Age of Housing Stock by State, 2023 02 07.
- National Association of Realtors. How a Home's Age Influences Owners' Renovation Plans, 2022 11 21.
- The Wall Street Journal. Here's Why You Should Consider Getting an Inspection Before Selling Your Home, 2023 02 10.
- Bob Vila. 8 Things Every Home Inspection Checklist Should Include, 2017 09 28.
- National Park Service. Weatherization of Historic Buildings: Repair and Upgrade Windows and Doors, 2022 04 11.
- Los Angeles Times. Don't toss those soulful old windows. Fix them, 2018 12 08.
- Family Handyman. 14 Tips for Living With Plaster Walls, 2025 05 28.
External links
- National Association of Home BuildersAlmost Half of the Owner Occupied Homes Built Before 1980
- National Association of Home BuildersAge of Housing Stock by State
- National Park ServiceWeatherization of Historic Buildings: Repair and Upgrade Windows and Doors
- Family Handyman14 Tips for Living With Plaster Walls
See also
-
 Design and Renovation
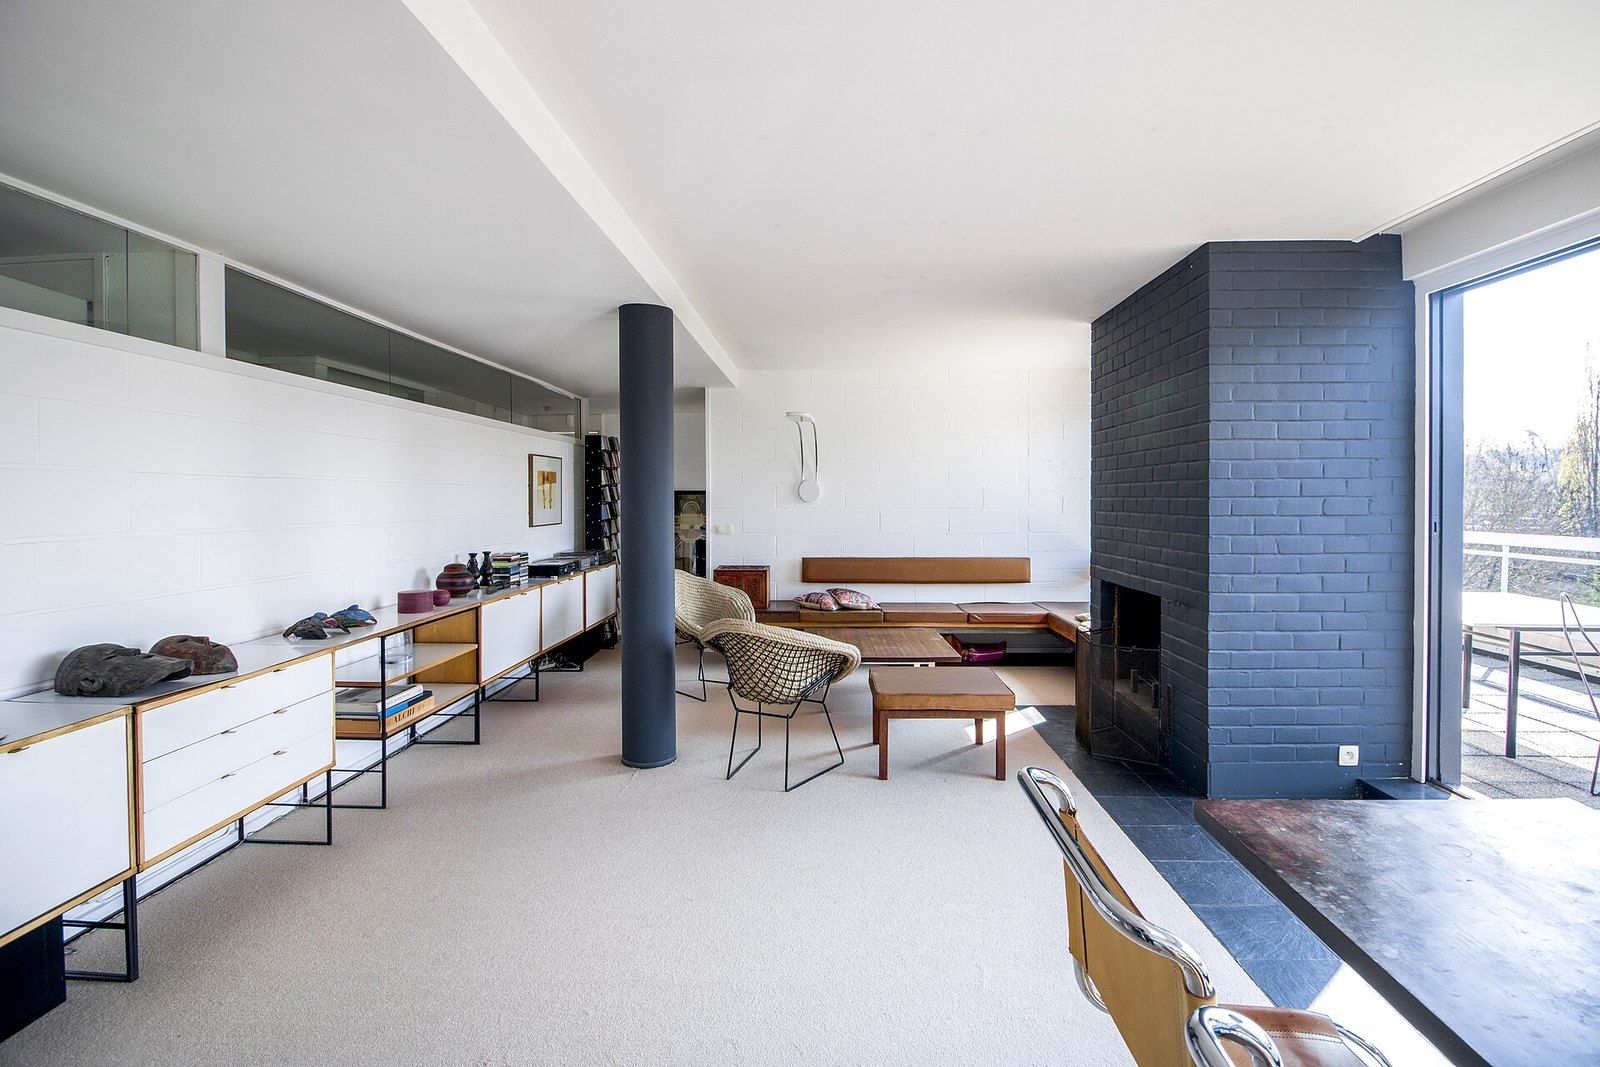
Home Staging
Editing, furnishing and photographing a house for visitors, with the survey numbers agents cite about it.
-
 Design and Renovation
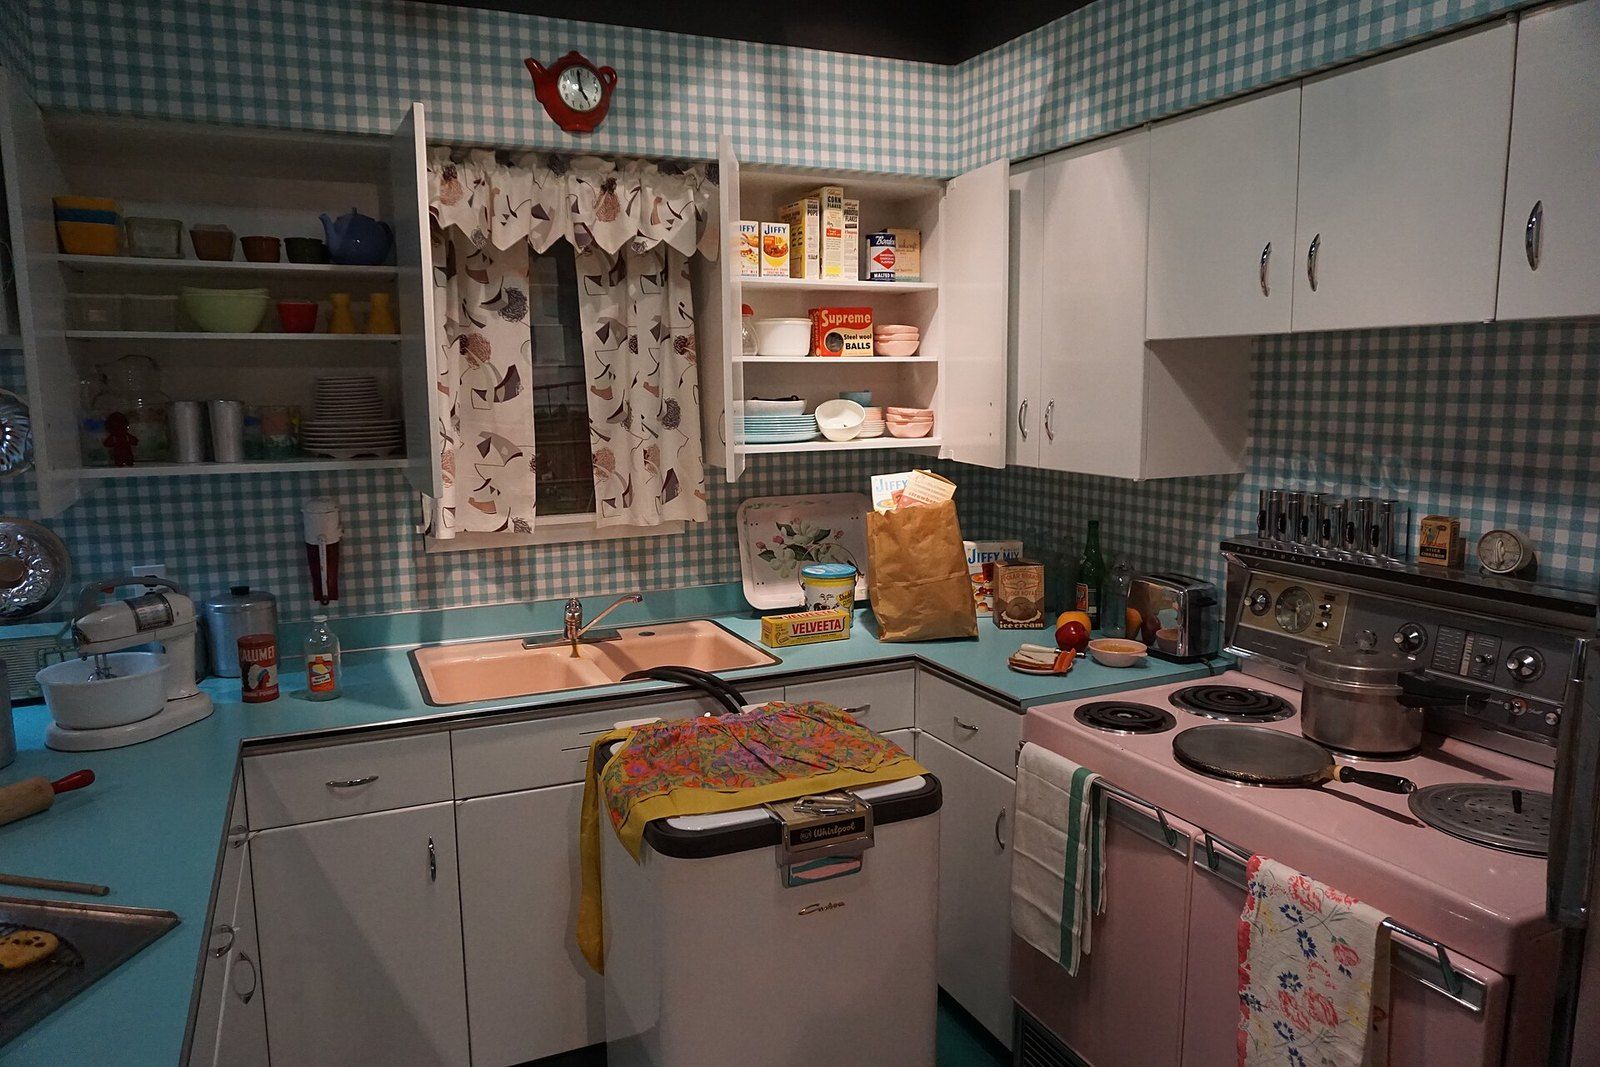
The History of the Kitchen
A century of cabinets, galleys and open plans, told through the planning rule that measured them all.
-
 Design and Renovation
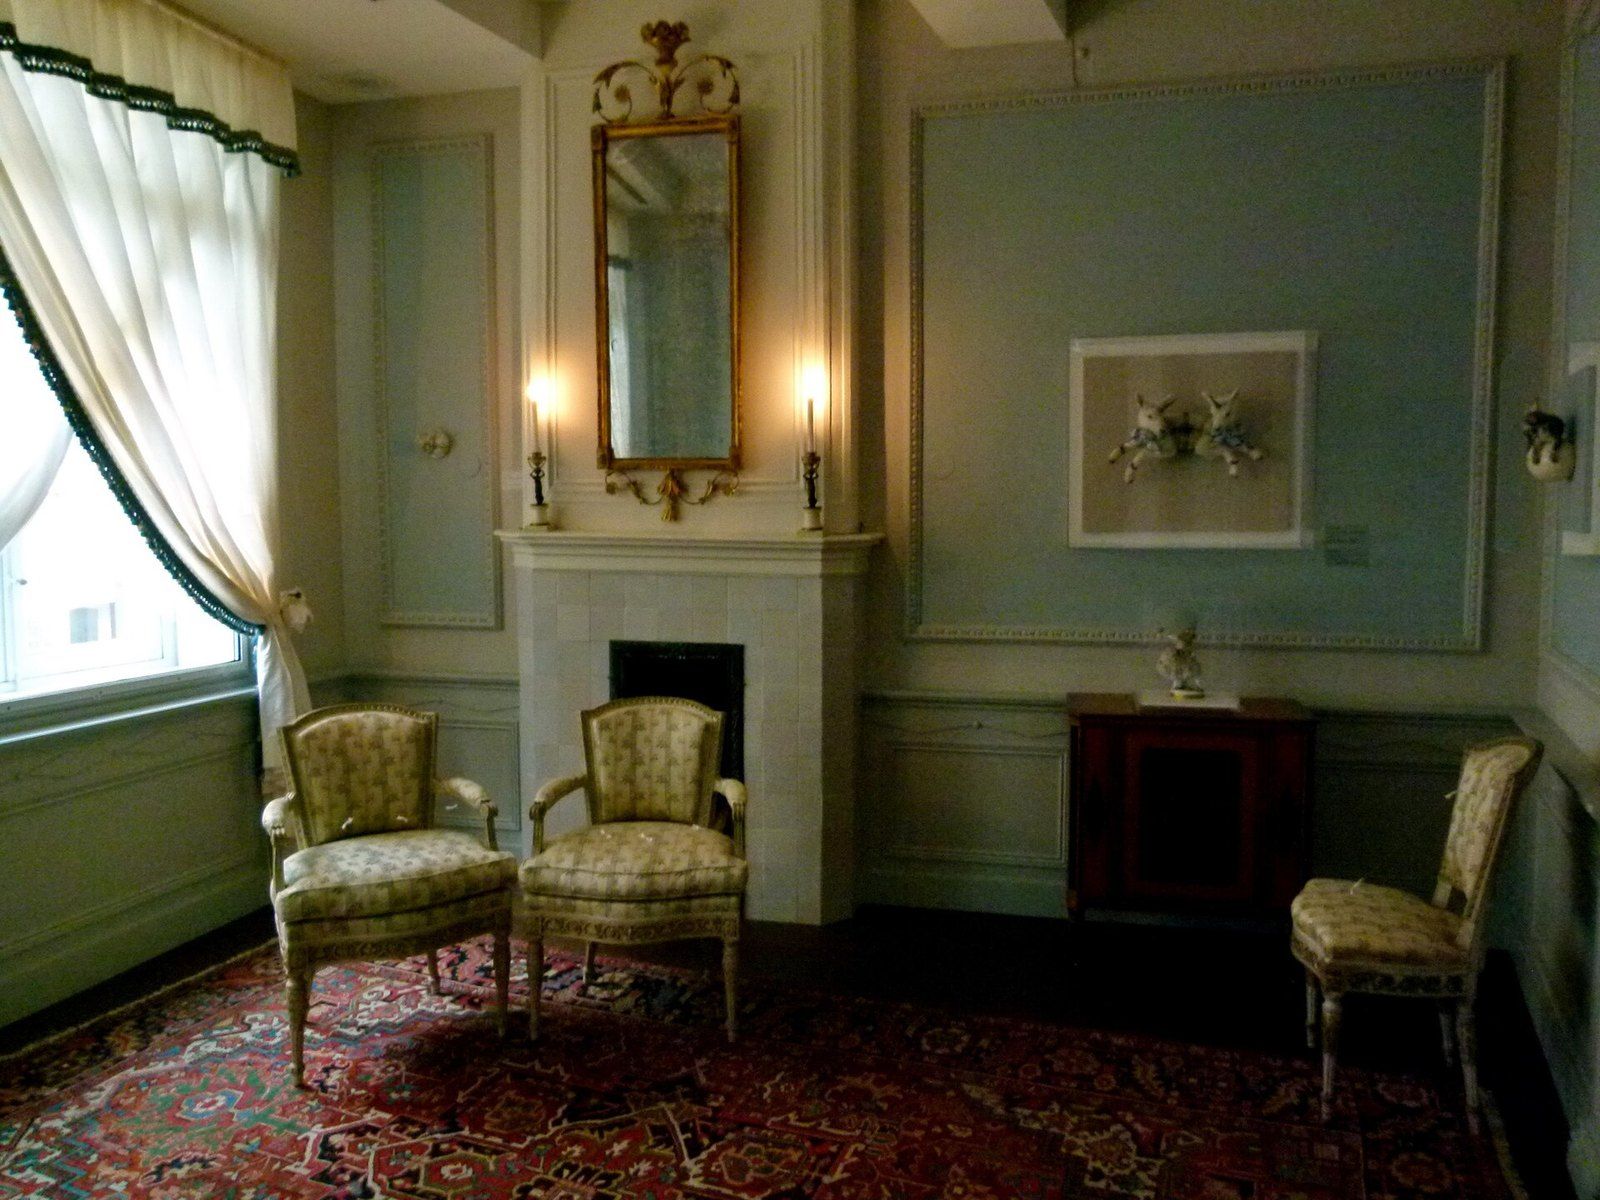
The History of Interior Design
How the furnishing of rooms grew from ornament for rulers into a field with its own famous names and arguments.
-
 Design and Renovation
Residential Lighting Design
Why rooms need several kinds of light, and how warmth, brightness and color accuracy are measured on a bulb.
-
 Gardens and Outdoor Living
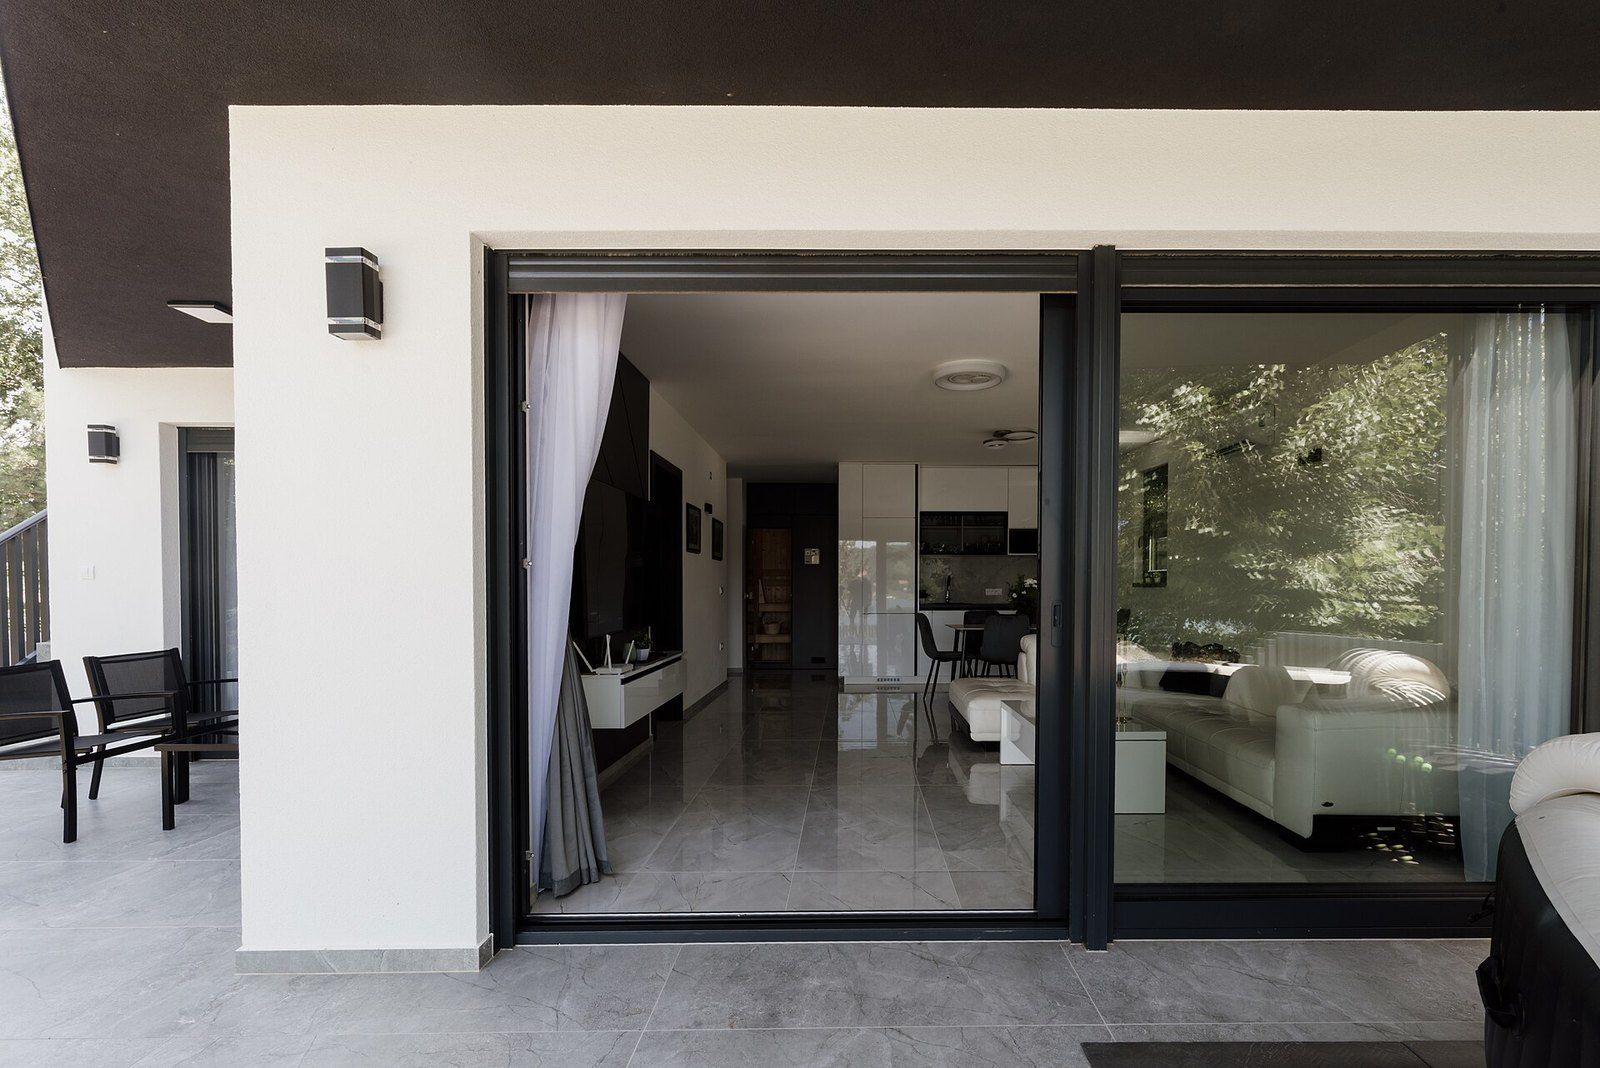
Indoor Outdoor Living
How a wall of sliding panels and a courtyard plan turned the California yard into a set of rooms.